 |
Monosilicon VS polysilicon's tear-off X battle has not stopped, and it has become increasingly fierce. Which is better? This article comprehensively analyzes polysilicon and monocrystalline silicon products in terms of market share, component decay rate, temperature coefficient, system cost, and yield. Want to thoroughly understand the advantages and disadvantages of these two technical routes, look at this is enough.
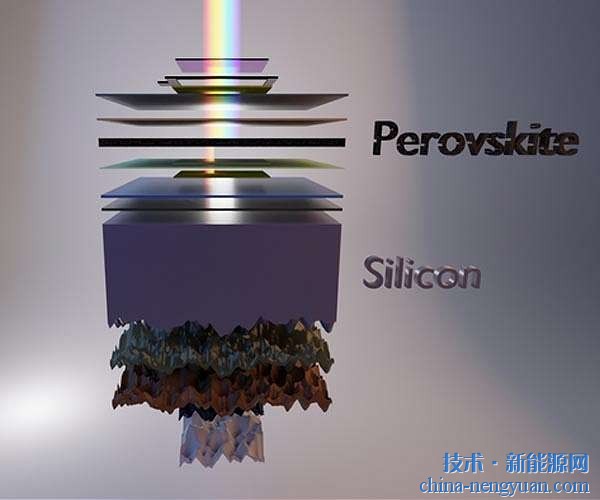
Photovoltaic cells have a variety of technological schools, crystalline silicon cells, thin-film batteries, organic batteries, dye-sensitized cells, perovskites, and the like. In many schools, crystalline silicon cells have been firmly occupying the dominant position, and the market share has been more than 80% since 2006. However, there is also competition within crystalline silicon cells. The competition between monocrystalline silicon cells and polycrystalline silicon cells has never stopped and has become more intense recently.
Monocrystalline silicon battery: I am old, efficient, stable performance;
Polysilicon battery: I am cost-effective!
Which is better? This article collects data from some of the open literature from 2012 to 2016 to explain, hoping to provide some help.
First, market share
The market is the standard for testing everything. Investors are spending real money, their choice is that they feel the best value for money, and market share data represents the choice of investors.
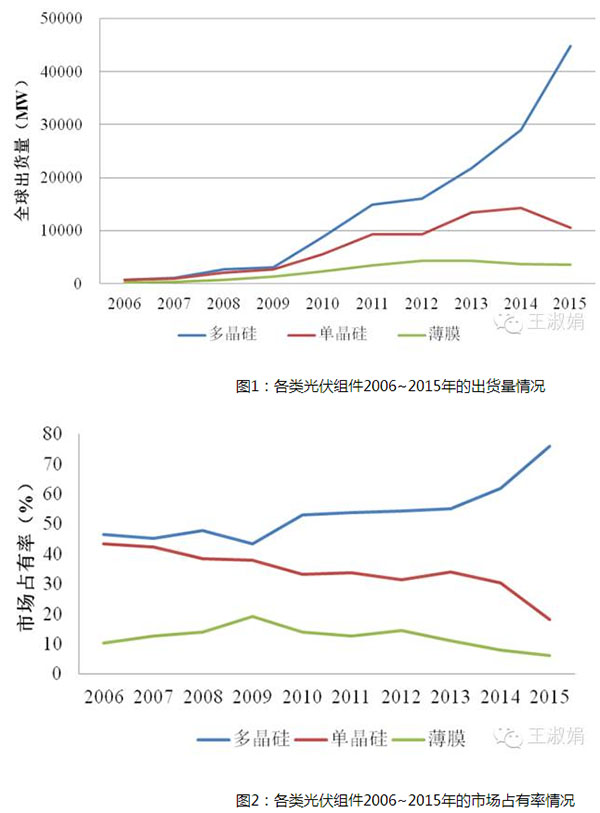
From Figure 1, Figure 2 can be seen:
1) The market share of polysilicon has been the highest; the market share of polysilicon has remained basically unchanged except for a slight drop in 2009;
2) The market share of monocrystalline silicon is basically equal to that of polysilicon, which is basically equal to that of the world, and it is less than 20% in 2015, and the market share continues to decline.
3) The gap between the shipment volume of polysilicon and monocrystalline silicon is gradually widening and the shipment of monocrystalline silicon is even slightly lower than that of 2014 in 2015;
4) From 2006 to 2009, the low-cost advantage of thin-film batteries was obvious, and the market share continued to rise; but then as the price of crystalline silicon batteries decreased, it continued to decline to 6% in 2015. Due to the increase in total installed capacity in the market, film shipments continued to increase until 2013; however, shipments in 2014 and 2015 continued to decline rapidly.
In summary, the high price/performance ratio of polysilicon makes it maintain a good market share.
Second, the component attenuation rate analysis
1 type of attenuation
The attenuation is generally divided into initial photo-attenuation and aging decay. In addition, PID potential induced decay has also been recognized in recent years.
1 Light Induced Degradation (LID)
The essential reason for LID generation is that solar cells generate recombination centers inside the material after receiving light. At present, it is generally accepted that the boron-oxygen complex produced after illumination reduces the lifespan of the child. Depletion of Boron in the boron-doped crystalline silicon and deeper energy defects excited by the interstitial oxygen under light irradiation cause carrier recombination and cell performance deterioration, resulting in a sharper output power of the PV module in the initial application for several days. Decline, but after a period of time (usually 2 to 3 months) the output power will gradually stabilize.
2 aging decay
The slow decay that occurs in the long-term application of photovoltaic modules can be divided into two categories:
1) The attenuation caused by the aging of the battery itself is mainly affected by the production process of the battery type (single crystal, polycrystalline) and the battery;
2) The attenuation caused by the aging of the packaging material is positively related to the production process and packaging materials of the photovoltaic modules and the environment of the components. Common cracking, yellowing of the appearance, wind and sand wear, hot spots, and aging of the components all can accelerate the power attenuation of the components.
3) PID potential energy induces attenuation. This attenuation exists in the high voltage between the component's internal circuitry and its grounded metal bezel, which can cause power degradation of the component, and is also related to glass, backplane, EVA, temperature, humidity, and voltage.
2 Decay rate test data
Single crystal and polycrystalline, in the end what kind of reduction in practical applications? Many PV module manufacturers have done a lot of research work on this issue. In order to illustrate the problem, this article only cited third-party research data to compare the decay rates of single crystals and polycrystals.
1) NREL Laboratory Statistics Report
In June 2012, NREL Laboratories of the United States issued a research report Photovoltaic degradation rates-An analytical review on the attenuation of photovoltaic modules. The data in this report is not the author's experimental data, but the statistics and analysis of the decay rate data of the components reported previously in a large number of documents.
First of all, the attenuation rate of different components is very different.
Figure 3 captures decay rate data for 1920 data points, including single crystals and polycrystals.
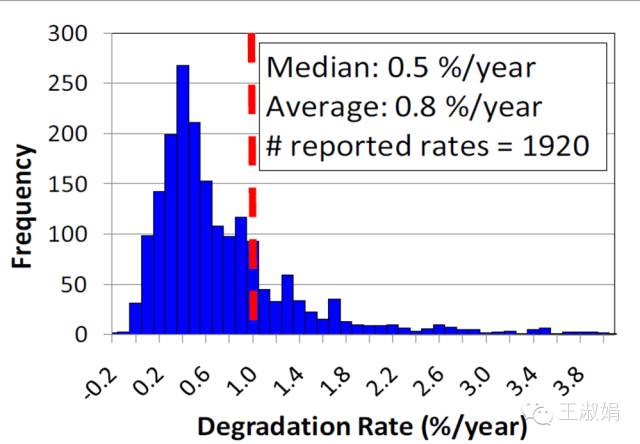
Figure 3: Decay rate of different crystalline silicon photovoltaic modules
As can be seen from the above figure:
The average decay rate of different components varies greatly. From 0.2%/year to 4%/year, the median decay rate is 0.5%/year, but due to the large number of high attenuation rate components, the average decay rate is 0.8%/year. Obviously, the PV modules sold in the market are not in good condition, and the quality of products from different manufacturers is very different. The selection of PV modules from first-line manufacturers is the basic guarantee for the future generation of PV projects.
In view of the large differences in the products of different brands, single-crystal silicon and polysilicon contrast tests conducted using only a few decimal brands only represent the performance of the brands used in the tests; if the number of brands used is not large enough, it cannot have a wide range of Representing significance.
Second, the decay rate of crystalline silicon photovoltaic modules decreases year by year.
The statistics of the attenuation rate of PV modules used at different times are shown in Figure 4.
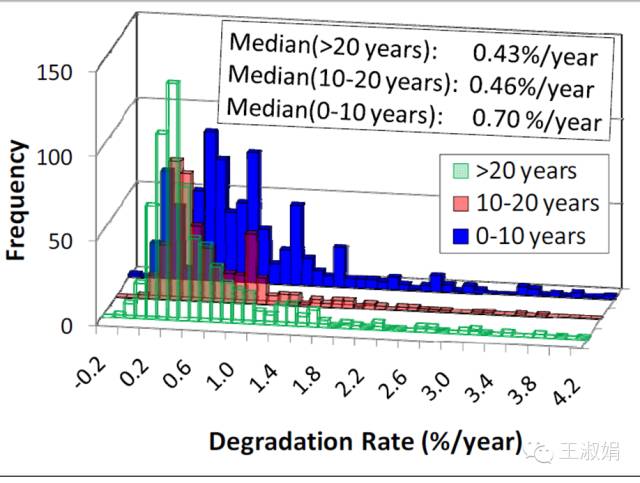
Figure 4: Decay rate of photovoltaic modules at different use times
From the figure above you can see:
The longer the usage, the lower the average annual decay rate. The first decade saw the largest decline with a median value of 0.7%/year, which is the same as the requirement in the National Development and Reform Commission’s “Opinions on Promoting the Application and Industrial Upgrading of Advanced Photovoltaic Technology Products (Guoineng New Energy [2015] No. 194)â€. When used for more than 10 years, the median decay rate is less than 0.5%/year.
Finally, look at the comparison of attenuation data for single crystals and polycrystals.
According to the installation time of PV modules, the data points are divided into two categories before installation before 2000 and after 2000; according to the state of the components tested, they are divided into two categories, components and systems.
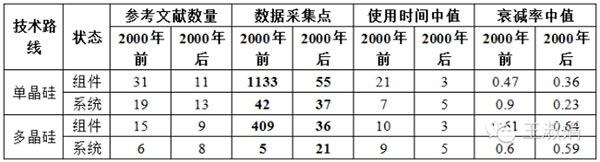
Table 1: Comparison of attenuation rates of monocrystalline silicon and polysilicon photovoltaic modules
In terms of the above table alone:
Data points before 2000, single-crystal silicon is 1175, while polysilicon is only 444; indicating that the median value of the use of single-crystal silicon is larger than that of polysilicon, and the application history of single crystal silicon photovoltaic modules is even longer.
Since attenuation is declining year by year, the data in Table 1 is compared with the data in Figure 4 to clearly illustrate the attenuation of single crystals and polycrystals, as shown in the table below.
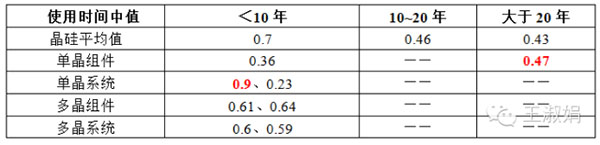
Table 2: Comparison of decay rates and average values ​​for monocrystalline and polycrystalline silicon
From the point of view of the median decay rate, the decay rate of monocrystalline silicon components and systems only 2000 years ago is higher than that of crystalline silicon. The others are all lower than the average value. Surprisingly, after 2000, the median attenuation rates of monocrystalline silicon modules and systems were 0.36%/year and 0.23%/year, respectively, far below the average value of 0.7%/year.
In summary, from the NREL laboratory's statistical report, it can not be judged whether single-crystal silicon and polysilicon have greater attenuation rates.
2) Japan AIST PV Technology Research Center releases data
A report by Shen Hui in October 2015 introduced the published data of Japan's AIST Photovoltaic Technology Research Center.
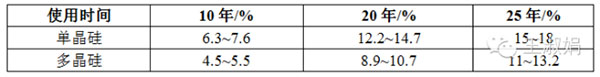
Table 3: Comparison of attenuation rates of monocrystalline silicon and polysilicon
From the above table you can see:
For 10 years, 20 years, and 25 years, the decay efficiency of polysilicon is lower than that of monocrystalline silicon. However, since this is a small-scale, short-term experimental data of a Japanese laboratory, the data is an extrapolation result, so the data has great limitations.
3) Data from Solar Energy Research Institute of Sun Yat-sen University
Many research institutions in China are also committed to attenuation research. The solar energy research institute of Sun Yat-sen University in Shunde has done two sets of attenuation comparison tests.
Test 1: Testing of old PV modules
The laboratory personnel performed laboratory tests on 656 pieces of photovoltaic modules that had been used in various environments throughout the country for more than 25 years. The basic conditions are as follows.

Table 4: Comparison of attenuation rates of monocrystalline silicon and polysilicon
In the above table, the number of single-crystal silicon samples is too small, and the comparison result may not be universally representative. However, the number of polysilicon components is large and can have a certain representativeness. The difference between the test results of the decay rate of the polysilicon component manufacturers of the two manufacturers is very large, which is the same as the statistical result of NREL Laboratories in Figure 3.
Test 2: Comparison of the actual power generation performance of photovoltaic arrays
Sun Yat-Sen University Solar System Institute installed six different types of solar battery grid-connected photovoltaic systems, including monocrystalline silicon and polycrystalline silicon, on the roof of Building C of Sun Yat-sen University’s Eastern Campus. The attenuation rates of the two types of components have not been obtained, and their single-watt generation is obtained as shown in the following table.

Table 5: Single-Watt Power Generation Comparison Chart for Single Crystal Silicon and Polysilicon (kWh/W)
As can be seen from the above table:
During the five months of monitoring, monocrystalline silicon generated 3.89% more power than polysilicon. However, due to a large number of factors that affect the power generation of the system, not only the performance of the photovoltaic module itself, but also monocrystalline silicon, polysilicon, and only a single brand, and the test time is short, so the results have little reference significance.
4) Experimental results of Yellow River Hydropower Photovoltaic Industry Co., Ltd.
The person in charge of the Yellow River Hydropower Photovoltaic Industry Technology Co., Ltd. announced their comparative test results at a meeting in January 2016, as shown in the following figure.
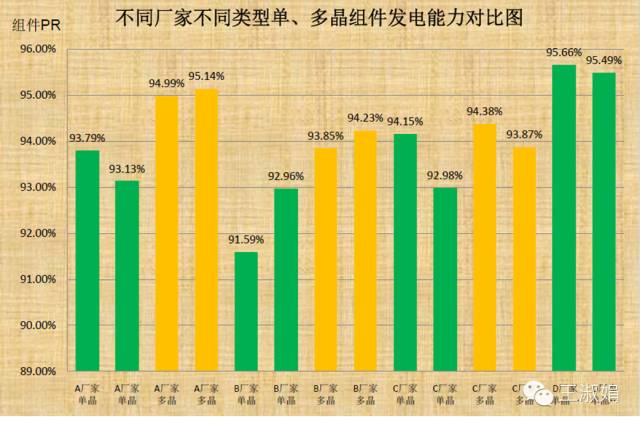
Figure 5: Decay Rate of Photovoltaic Modules of Different Brands
As can be seen from the above figure:
Monocrystalline silicon (green) and polysilicon (yellow) are staggered in efficiency. The lowest attenuation rate is the monocrystalline silicon module of the D manufacturer and the highest monocrystalline silicon module of the B manufacturer.
This figure also shows that the impact of the production quality of the component manufacturers on the attenuation rate may be higher than the impact of the component type on the attenuation rate.
5) Data from a testing center in China
In an academic exchange, I learned the test results of a testing agency in Hainan, China. Due to respect for the research of this institution, the details of this data are not published in this paper.
The experimental base selected two brands of monocrystalline silicon modules and 34 brands of polysilicon modules for testing, and is now close to one year of complete data. The data shows that among the 36 brand components, the decay rate of the two brands of monocrystalline silicon modules is probably in the 5th and 6th.
6) Several sets of third-party data summary
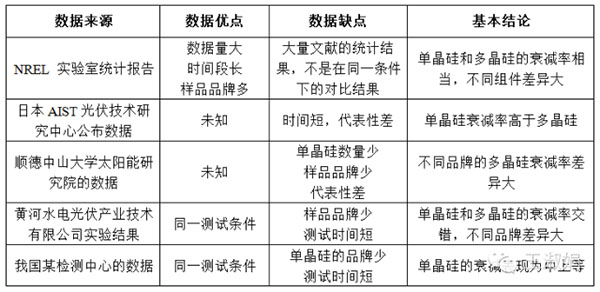
Table 6: Comparison of third-party analysis data
From the above summary table we can see:
From a number of third-party studies on the attenuation rate of monocrystalline silicon and polysilicon, it is difficult to distinguish which type of attenuation rate is lower; instead, different brands of components have a greater impact on it.
3 Analysis of reduction rate comparison results
This article briefly analyzes the above conclusions from the causes of attenuation.
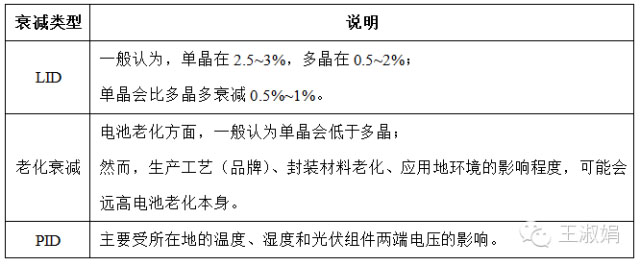
Table 7: Analysis of attenuation results from decay causes
From the above analysis:
In the 10% 10 years and 20% 25 years of decay rate promised by the general manufacturers, it is mainly caused by aging decay; and the influence of factors such as production process (brand), aging of packaging materials, and environment of application on aging decay. , may be far higher battery aging itself.
The first-line component manufacturers use good packaging materials to protect the battery, and the attenuation of the components will naturally be low. The use of the components in a dry and cool environment will inevitably be lower than the attenuation rate under hot and humid conditions. This also explains why the impact of component types (monocrystalline silicon, polysilicon) on the decay rate of components is lower than that of the brand and the use environment.
In summary:
Whether the type of component is monocrystalline silicon or polysilicon is not the most important factor that affects the attenuation of components. In view of this, it can be assumed that the use of single crystal silicon or polysilicon does not affect the power generation of the project under the same conditions.
Third, the temperature coefficient analysis
In addition to the decay rate, the temperature coefficient of the PV module also affects the power generation. This article collects 19 brands of photovoltaic modules from 8 brands. Their temperature coefficients are shown in the table below.
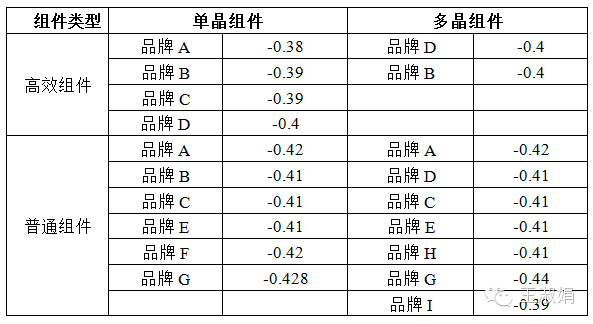
Table 8: Temperature Coefficients of Different Brands and Different Types of PV Modules (Unit: %/°C)
From the above table you can see:
Only in terms of the temperature coefficient promised by the manufacturer in the technical specifications:
1) Some brands have high-efficiency components and their temperature coefficient is generally lower than that of ordinary components.
2) There are certain differences in the temperature coefficient of different brands. For the common components of 8 brands, the variation range is between -0.39 and -0.44%/°C.
3) Common components of the same brand, the temperature coefficient is basically the same.
From the above analysis, there is a certain correlation between the temperature coefficient and the type of component (monocrystalline, polycrystalline), but the difference depends more on the manufacturing process of different brands.
Fourth, system cost data comparison
In terms of photoelectric conversion efficiency, single crystals are higher than polycrystals. Therefore, regardless of the cost of the component, the system cost of the single crystal may be lower than that of the polycrystal.
In order to more accurately compare the system cost, select the mainstream products currently on the market for analysis. The conversion efficiency of the selected single crystal module was 16.8% (275W, 60 sheets), and the polycrystalline sheet conversion efficiency was 16.2% (265W, 60 sheets).
Monocrystalline: 22 275W single crystal modules form a photovoltaic string, 166 photovoltaic strings form 83 matrixes, and 12 sink boxes form a 1.043MW power generation unit.
Polycrystalline: 22 265W monocrystalline modules form a photovoltaic string, 172 photovoltaic strings form 86 matrixes, and 12 combiner boxes form a 1.00276MW power generation unit.
Starting from inverters and box changes, there is no difference between the two. Taken together, the cost difference between the two is shown in the table below.
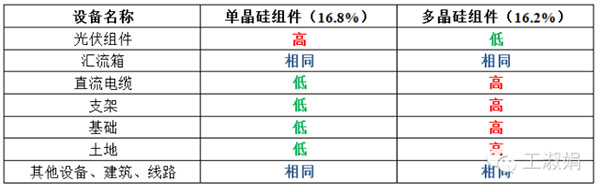
Table 9: Cost Comparison of Different PV Systems
In summary:
The use of different conversion efficiency components, cables, brackets, foundations, land (hereinafter referred to as "accessories") costs vary. When polycrystalline with a conversion efficiency of 16.2% was used, the cost of the auxiliary material was about 3.62% higher than that of the single crystal with a conversion efficiency of 16.8%.
Due to the differences in construction conditions of different power stations, the cost of auxiliary materials (cables, supports, foundations, and land) is approximately between 2 and 2.8 yuan/W. Therefore, in terms of the cost of auxiliary materials, polycrystalline auxiliary materials are approximately 7~10 points/W more expensive than single crystal auxiliary materials.
Therefore, if the price difference between the monocrystalline module and the polycrystalline module is within 10 minutes/W, the overall cost of both parties will remain flat.
V. Effect of yield analysis
The project's yield is mainly affected by the "power generation", "initial investment" and "operation and maintenance costs."
According to the foregoing analysis, if other conditions are the same:
1) The use of monocrystalline silicon or polysilicon does not affect the power generation of the project;
2) If the price of monocrystalline silicon module is within 10 points/W of that of polysilicon, the initial investment of both can be kept flat;
3) Because the difference in the number of equipment is only 3.62%, the difference in future operation and maintenance costs can be basically ignored.
In view of the above reasons, in the project yield rate, the price difference between monocrystalline silicon and polysilicon is higher than 10 points/W, and it may be that polysilicon has a slight advantage.
Sixth, the main analysis conclusions
According to the literature data from 2012 to 2016, the single crystal silicon and polycrystalline silicon were compared and analyzed from various aspects, and the following basic conclusions were obtained:
From the perspective of market applications, polycrystalline components are superior to single crystal components;
From the perspective of the decay rate, the performance of single-crystal modules and polycrystalline modules is basically the same, depending on the brand's production process, packaging materials, and product application environment;
The temperature coefficient depends on the brand of the product.
From the point of view of the cost, when the price of a single crystal module is 10 cents/W less expensive than polycrystalline, the two can basically be kept flat;
From the profitability point of view, given that the other conditions are the same, different types of power generation can be considered to be basically the same, so they are mainly affected by the cost.
Comprehensive analysis, because the performance of the component is greatly affected by different brands, the comparison of single crystals and polycrystals by only a few brands can only illustrate the product performance of the selected brand, and does not have a wide representative significance. For investors, how the project chooses PV modules should focus on the following factors:
The brand of the component. According to the detailed analysis in the previous section, different brands of components, their production processes, and packaging materials have a large influence on the attenuation rate, and thus affect the power generation.
The price of the component. The difference between the two prices will affect the initial investment and thus affect the project's yield.
In the face of technical disputes between monocrystalline and polycrystalline manufacturers, a well-known industry analyst has broken down: Monocrystalline silicon and polysilicon have not yet reached the fight technology, fight sincerity is enough! (ã€All-around omnipotent author, Lu research group】)
In the modern industries, advanced ceramic component is very commonly used in many, many electron vacuum devices, like electron tubes, high voltage feedthru, high current feedthru, vacuum interrupter, vacuum capacitors/Thyristors, X-ray tubes and power switches and so on.
The key point is what a metal coating covers on the surface of ceramic body, or ceramic base to achieve the vacuum hermetical and sealing, such as nickle plating, sliver plating, gold plating, copper plating and Tin plating. The main features for Vacuum Ceramic Component as below:
-Extremely high bond/brazing strengths
-High mechanical strength
-Minimum electric resistance and vacuum tightness
-Excellent insulation
The typical form for vacuum ceramic component is to be as an insulator, ceramic packaging and ceramic body etc.
Vacuum Ceramic Component
Vacuum Ceramic Component,High Current Vacuum Ceramic Component,High Temperature Vacuum Component,Advanced Vacuum Chamber Ceramic Components
Jinghui Industry Ltd. , https://www.ceramictek.com